The GPIB-based automatic test system is a product of the combination of computer technology and automatic test technology, and is currently widely used in many fields. This article introduces the composition of the GPIB-based automatic test system and the principles and characteristics of the GPIB technology. It focuses on the car audio test system that has been used in the actual application of the project. This system greatly improves the degree of automation of the test and allows testers to Freed from the heavy test task, you only need to focus on the design of the test program and the writing of the test sequence, thus highlighting the superiority of the automated test system.
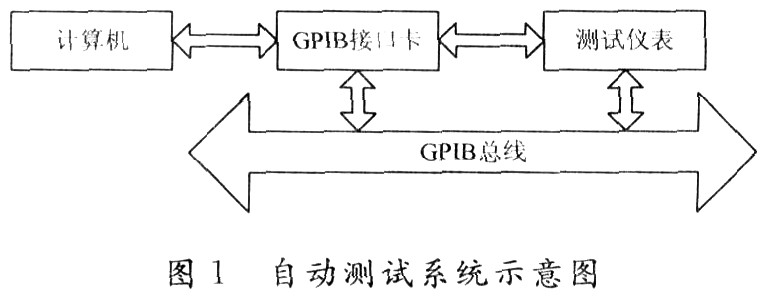
1 Automatic test system A test project is that the computer sends a message to several test instruments. The computer and the test instrument are connected by a GPIB line. This requires that the test instrument used must support CPIB. The message sent is actually SCPI (Standard Command for Program—ming Instrument) language. In recent years, the new test instrument has a GPIB interface, so that it can be connected to a computer to form an automatic test system. The system not only improves the measurement accuracy of the instrument, but also has data processing capabilities, and can replace hardware with software or even complete functions that the hardware cannot. Generally speaking, a complete test system consists of controller, test instrument, test software and interface bus, as shown in Figure 1.
2 GPIB technical characteristics and working principle
2.1 Features of GPIB (1) The GPIB interface board is placed inside the device. The designer does not need to consider the problem of designing the interface. This interface is suitable for any system that the device can participate in. Its versatility is self-evident.
(2) GPIB has advanced features. It only needs to move the device and plug the cable plug during operation. It does not involve the specific hardware design of the connector. This is because GPIB introduces some advanced interface concepts, and the function, electrical and institutional The regulations formulated are quite complete, ensuring full compatibility. This feature of GPIB is expressed in programming, which is to reduce the burden of software design, and can be programmed with high-level languages.
(3) The GPIB system is flexible to set up and dismantle, and is easy to use. The system built with GPIB interface equipment is a true "accumulated" system. They are "accumulated" to become an automatic test system. Unmatched flexibility.
(4) The GPIB interface is about 10% more expensive than the general interface, but considering the formation of a test system to connect multiple peripherals, the GPIB interface is cheaper than the general interface. Therefore, from the aspects of versatility, compatibility, flexibility and economy, the GPIB interface is unmatched by other interfaces.
2.2 GPIB bus GPIB system generally requires 3 different elements for effective information transmission: speaker, listener and controller. Its data transmission adopts bit parallel, byte serial, bidirectional hooking and bidirectional asynchronous mode. There are 24 buses in total, which can be divided into 3 categories: 16 signal lines, 1 shielded line, and 7 ground lines. The signal line is divided into 3 groups: the first group is an 8-bit data bus, used to transmit data, commands or status words. The second group is the interface management bus, which is composed of 5 signal lines: ATN, IFC, REN, SRQ, and EOI, which are used to control the bus process and act as the bus command. The last group is 3 hook lines (DAV, NRFD, NDAC), which are used for data communication to ensure the smooth transmission of asynchronous transmission.
2.3 Three-wire hooking process Data transmission is carried out in a three-wire hooking way between the speaker and the listener. The basic process is:
(1) The sender sends data to the data bus, but does not declare the data valid, that is, DAV = 0;
(2) The receivers are successively preparing to receive data, and jointly use NRFD = 0 to indicate to the sender that they are ready to receive data;
(3) When the sender confirms that all receivers are ready to receive data, it sends a message of DAV = 1, indicating that the data placed on the data bus by the receiver can be received;
(4) When the receiver confirms that the data can be received, the signal NRFD = O no longer needs to be retained, so the state of NRFD = 1 is restored to prepare for the next cycle;
(5) The receiver starts to receive data;
(6) Due to the different data receiving speeds, the receivers receive data one after another. When the device with the slowest receiving speed is received, make the bus NDVC = 0, indicating that all receivers have received the data;
(7) When the sender confirms that all receivers have received the data, the original "data valid" message DAV = 1 does not need to be retained, so DAV = 0 is sent, and the data on the data bus is removed;
(8) Each receiver restores NDVC = 1 according to the received DAV = 1 information. At this point, the three lines of DAV, NRFD, and NDAC have all returned to their original states, indicating the end of an interlocking contact cycle and doing well for the next cycle Ready.
3 GPIB-based car audio test system
3.1 Hardware system
3.1.1 Test system introduction This project is a car audio integrated rack test automation system. Considering the future expandability of the system, the unified platform structure of the test automation system will be fully adopted. On this structure, the functions of the audio part will be realized. The car audio test system is mainly divided into 5 parts: dual channel audio signal generator and dual channel audio signal analyzer, standard signal generator, audio switch, controller, standard DC power supply and software system. Jointly assume complete system functions. Among them, the audio analyzer, signal generator, and DC power supply all use German high-performance test instruments, which can complete accurate test requirements. The audio analyzer includes dual-channel audio signal generation and signal analysis. It has extremely high sensitivity and rich special functions for acoustic testing. Its parallel working mode fully meets the requirements of stereo testing. Signal generator RF signal generator with UPV can generate FM signal and stereo signal, and can be used as interference source for receiving test.
Audio switch The audio switch is composed of two parts: switch box and switch box host. The switch box is used for matrix switching between audio signal paths, such as: switching between stereo and other test items; the switch box host controls the switch box through the PCI board to ensure that any test items do not require manual intervention of audio line connections.
Controller The controller uses an ordinary PC, which mainly completes the control of various instruments and related software.
DC power supply The standard DC power supply is mainly used to power the audio equipment under test. It can meet the power supply requirements of car audio.
The software system software is completed using Microsoft Visual C ++, and runs under the Windows XP environment. All the test work of the testers is completed under the software, including the selection of test items, the control of test sequences, the display of test results (including the display of charts, etc.), the storage of test results, and output reports. The tester's job is just to select the corresponding test item to start the test. The control of the instrument, the display and saving of the final result are all carried out by the software.
3.1.2 Test principle The standard signal generator SML analog radio station generates radio frequency signals, and the audio analyzer UPV generates modulation signals to modulate the radio frequency signals generated by SML through the SML's ModulaTIon port. The modulated signals are output to the SML's RF port to The audio under test, the audio under test generates audio signals through a series of transformations, and then output to UPV. The audio analyzer UPV analyzes the audio signals generated by the audio under test to produce the results of the test requirements.
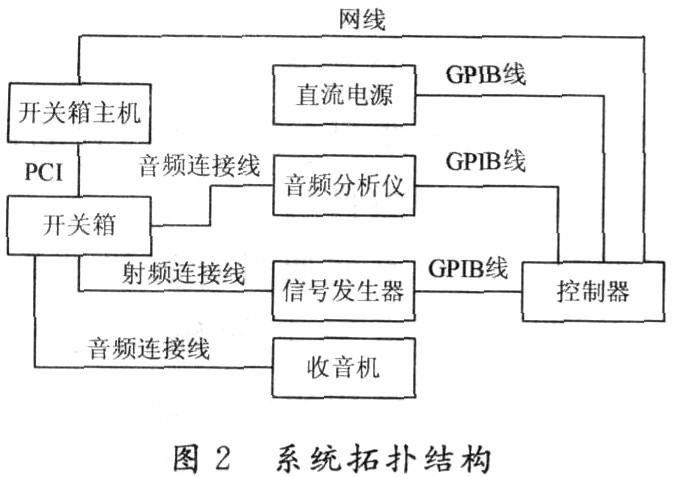
3.1.3 System topology structure The system topology structure is the connection schematic diagram of the entire system, as shown in Figure 2. The controller and the test instrument are connected by GPIB line, the audio analyzer and the switch box are connected by the audio cable, the standard signal generator and the switch box are connected by the RF cable, and the radio and the switch box are connected Connected through the audio cable, the switch box host and the controller are connected through a network cable, and the switch box and the switch box host are connected through PCI.
3.2 Software system The system selects Windows XP operating system as the operating environment of the system, and uses Microsoft Visual C ++ as the system software development platform to develop the application program interface. Use Visual C ++ according to the SCPI command of the test instrument. To write a hardware driver library.
The software adopts modular programming method and is divided into different functional modules: hardware driver part, system interface part and data management part.
3.2.1 Software design ideas The design of system software mainly adopts object-oriented design ideas. The structure of application software based on object-oriented technology is easy to understand, modify and reuse, and can significantly improve the efficiency of software development and maintenance.
In the software design, each test instrument is encapsulated into classes according to various devices and their functions, that is, signal source class, signal analysis class, power supply class, etc. The functions and variables that operate on each instrument are encapsulated as class methods and attributes In various categories. These classes describe a group of common objects with common methods and general characteristics. For example, the signal source class characterizes the common properties of the signal source, such as the selection of waveform types and the setting of waveform parameters. The CObject class is used to derive a measurement data class, and the sampling data is used as the main attribute of the measurement data class, and various measurement sampling methods, data processing methods, and data representation methods are used as the interface methods of the measurement data class. Using this method and combining design patterns and polymorphism helps to standardize and freely extend the interface.
Construct measurement data classes, using direct packaging structures and arrays. Since the amount of measured data is generally large, global objects and shared memory files are also commonly used methods. You can also use template classes, such as CArray class, CList class, etc. They all support the dynamic addition of complex classes.
The software uses COM component technology to encapsulate various data processing algorithms, such as fast Fourier transform, filtering, etc., to process the data, and then for the user interface. The Component Object Model (COM) defines how various objects communicate with each other using a common agreed protocol and is a standard independent of language and platform. The most important feature of COM components is their object-oriented nature. Through object-oriented technology, the user interface does not need to pay attention to what kind of hardware it is operating. It only needs to use the agreed protocol through the public interface to send and receive data and commands to the component, and the specific operation is completed by the component, thereby achieving device-independent Sex. In the user interface, the restriction relationship between interface elements can use the Win32API function LoadCurroe to call the waiting cursor to temporarily block other interactive operations, or use CWnd :: EnableWindow, CWnd :: ShowWindow to set corresponding interface controls to block some interactive operations. This can easily realize the function of shielding other operations when performing an operation.
The software design uses VC ++ multi-thread programming technology. Multi-thread is to make multiple threads work in parallel to complete multiple tasks and improve the efficiency of the system. In this test system, because data collection and data processing are parallel, it is necessary to design two threads in the software: one thread to perform the test and read the test results; the other thread to perform the interface display of the test results. Parallel tasks can be implemented with CWinThread-like threads. Threads communicate through messages and use global variables to transfer data. In addition, coordinated synchronization between the two threads must be resolved to achieve synchronization of testing and display, and respond to user control of the experimental process in a timely manner.
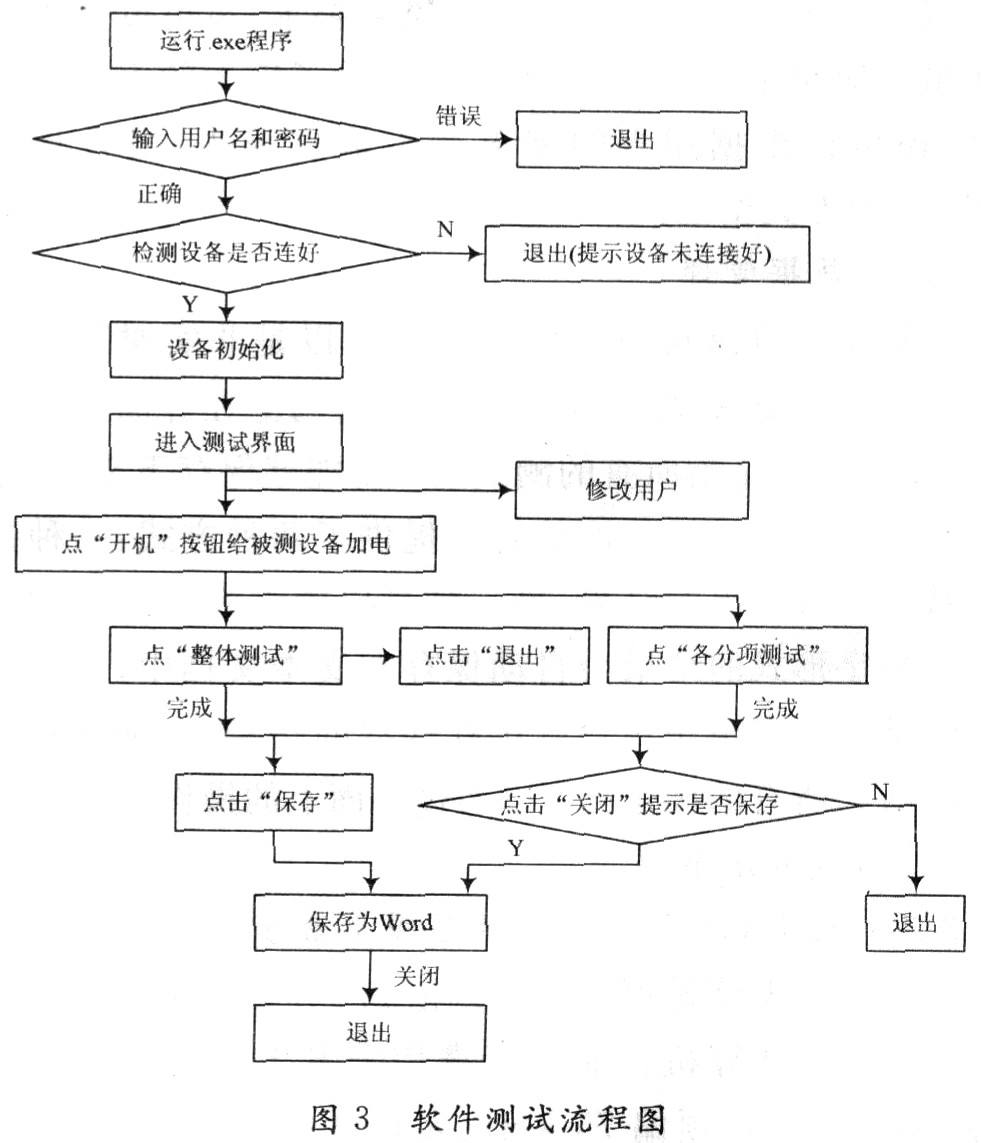
Moreover, in order to test the need, sometimes you need to send a custom message from a certain class. There are two forms of message sending: SendMessage and PostMessage. You can also use the system to register the message RegisteWin-dowMessage for multiple instruments to collaborate. Event response technology is message-driven, and control commands can be formed by responding to interactive events on the user interface, and measurement control actions are implemented in message response functions. Use the message mechanism to trigger the sampling method of the measurement data object, and operate the instrument driver to obtain the measurement data; after the measurement data arrives, it is processed, expressed, and finally presented to the user. This is the workflow of the system software. It is realized through the user interface and the two central objects of measurement data, using messages as the medium. The software test flow chart is shown in Figure 3.
3.2.2 The hardware driver, that is, the driver of the interface board, is the lowest layer of the system control software. It directly controls the GPIB interface board to realize the I / O operation of the signal. Design the interface library function according to the function, and wrap the interface library function in the dynamic link library DLL (the dynamic link library is a number of modules containing function sets and data, which provides a modular application method). The writing of the hardware driver is completed according to the SCPI command provided by the test instrument, and it is written using Visual C ++. Compiled with VC ++. exe file, put people directly into the application. The XML file is generated by the application software, and the file contains the written hardware driver library information, and the user can find the relevant driver information from the file.
3.2.3 System interface The core of the software part, which directly faces the user, is the uppermost layer of the system control software. The system has a good human-machine interface. On the one hand, it allows users to flexibly select the test items to be conducted, and prompts the user to complete the operation through a prompt dialog box, and can display the current test status in real time, such as: test start , The test is in progress and the test is complete. On the other hand, users can complete various functions through the interface, such as: selecting items to be tested, including amplitude modulation (AM), frequency modulation (FM), stereo modulation (STEREO) and CD testing. Each test item will have several sub-test items, for example: AM includes noise limit sensitivity test, interference frequency test, automatic amplifier test, etc. After the user selects the test item, its corresponding sub-test items will be listed for the user to choose flexibly. In addition, the test results can be displayed in the interface immediately after the test is completed. While displaying the results, all the results are also saved. The user can view the saved results through the operation buttons on the interface. This method allows users to monitor whether the test indicators meet the requirements in real time, and also allows users to analyze the results after the event, providing users with great convenience. At the same time, an output report can also be generated according to the needs of users, and the report is given in the form of Word.
3.2.4 Data management Data management can be real-time or non-real-time. Real-time means that the test results will be displayed on the interface immediately after the test is completed, and non-real-time means that all test results can be saved for later use by the user. There are two ways to manage data: one is to give the results in numbers, and the other is to give the results in graphs. The results in digital form will be automatically saved in the text document, and the results in chart mode can be selected by the user to save the path, this method is more flexible. All operations can be completed through the operations on the interface.
3.3 Examples of test methods
3.3.1 Noise Limiting Sensitivity Test of FM Based on GPIB (1) First tune the radio under test to 94.1 MHz;
(2) The standard signal generator is provided with computer control to provide the antenna interface of the signal radio with FM modulation, 94.1 MHz, frequency deviation of 75 kHz, and high frequency level set to 4 dBμV. The modulation frequency of 1 kHz is generated by the audio analyzer.
(3) The FM noise-limiting sensitivity test item selected by the software can start the test.
The test results are judged according to the TL972 standard. The TL972 standard stipulates that the noise-limiting sensitivity of FM should be 4-8 dBμV.
3.3.2 Frequency response test of CD based on GPIB (1) First play the test track (usually the frequency sweep track, play the frequency sweep track of 20 Hz ~ 20 kHz).
(2) Every time the frequency is changed, the output of the audio analyzer is read by the computer, that is, the output level at the corresponding frequency (unit is dBμV). Record each frequency and the corresponding output. After all frequencies are played, the software interface will automatically draw a frequency response graph, and the corresponding frequency and output will be given in a list at the same time.
(3) Save the data of frequency response graph and list mode for future reference.
Using a computer to control the test instrument through GPIB to complete the test ratio, the manual test greatly improves the workload of the tester, fully automates the test work, reduces manual intervention, and greatly increases the test speed and accuracy.
4 Conclusion The GPIB-based automatic test system has fully utilized the advantages of virtual instruments, with accurate test results and good real-time performance. At the same time, the software adopts object-oriented design ideas, which is conducive to further expansion or modification. This system has been successfully used in car audio testing. It has been verified by practice to have high reliability, high accuracy of test results, stable system, convenient and fast software upgrade, and good portability.
Mono panel,High Quality Mono panel,Mono panel Details, Yangzhou Bright Solar Solutions Co., Ltd.
Yangzhou Bright Solar Solutions Co., Ltd. , https://www.solarlights.pl