**Foreword**
The rolling mill is one of the most critical pieces of equipment in a steel production line. Its performance and reliability directly influence the overall productivity of the enterprise. Among its key components, the rolling mill drive shaft plays a vital role. If it fails or gets damaged, it can cause serious disruptions in the production process, leading to significant financial losses.
As rolling speeds and output increase, the mismatch between the equipment and its load becomes more pronounced. Additionally, during the steel rolling process, especially in the roughing stage where R1 and R2 rolling mills are reversible, there are frequent starts, stops, and sudden engagement or release of the workpiece. These actions result in abrupt changes in the mill’s load, which can lead to mechanical stress and damage over time. Many steel companies have experienced major accidents involving the main drive system, which severely impacted normal operations. The lack of real-time monitoring makes it difficult to assess the condition of the drive system at the time of an incident, complicating root cause analysis and preventing timely warnings or predictions of potential failures.
There are multiple causes for drive shaft failure, and traditional load and strength calculations often fall short in identifying these issues. Research indicates that many of these failures are closely related to torsional vibrations in the drive shaft. Determining whether torsional vibrations occur, whether they reach dangerous amplification levels, and whether destructive resonance takes place is crucial for ensuring safe and efficient operation. To prevent such incidents, improve equipment availability, and enable real-time monitoring and analysis of the main drive system's torque, it is essential to implement an advanced monitoring system. This not only helps operators make informed decisions but also enhances the safety and efficiency of the entire production process.
The torque and torsional vibration of the rolling mill are closely linked to the rolling process parameters. This project focuses on real-time monitoring and analysis of torque signals to capture the maximum, minimum, and average torque values per pass. By combining online data with theoretical models, a rolling torque prediction model is developed. Comparing calculated values with actual measurements allows for the optimization of rolling parameters, improving the rolling rhythm, increasing production capacity, and enhancing equipment integrity and safety.
**Development of a Torque Monitoring System for the Roughing Mill**
**2.1 Monitoring Object and Measurement Point Arrangement**
The primary focus of this system is the torque of the main drive shaft. Key monitoring parameters include:
- Torque, speed, power, and rotational direction of the R1 and R2 main drive shafts
- Process-related variables such as rolling force (P), main motor current, coil number, rolling pass, material type, slab dimensions, casting temperature, R1 and R2 exit temperatures, inlet and outlet thicknesses, and temperatures
Among these, the torque, speed, power, and direction of the main drive shaft are real-time synchronized signals, while the other eight process variables serve as auxiliary signals.
Torque measurement points are located on the upper and lower universal joints (see Figure 1). Four strain gauges are mounted on the drive shaft at 45° angles relative to the axis (as shown in Figure 2), forming a full-bridge configuration (Figure 3). The bridge signal is transmitted via a wireless telemetry device to an embedded data acquisition system, which then sends the data to the server. Table 1 provides a summary of the torque monitoring points for the roughing mill.
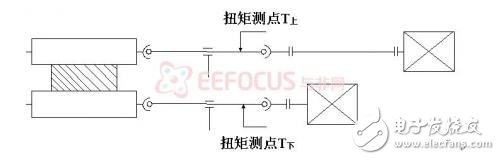
**Figure 1: Schematic diagram of the main drive measuring point arrangement of R1 and R2 rolling mills**
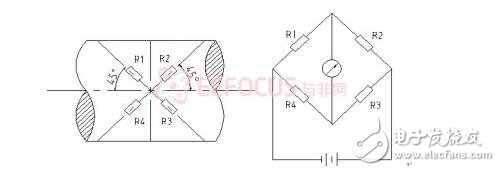
**Figure 2: Schematic diagram of the torque test patch**
110 Inch Interactive Conference Board
INTERACTIVE FLAT PANEL,INTERACTIVE TOUCH MONITORS,INTERACTIVE FLAT PANEL DISPLAY PANEL INTERACTIV
Jiangsu Qilong Electronic Technology Co., Ltd. , https://www.qilongtouch.com