In order to verify the clinical effectiveness of its main product, XX new drug, in treating angina pectoris, a pharmaceutical company randomly selected 100 patients who met the diagnostic criteria into a treatment group and a control group, 50 patients in each group. The treatment group was treated with XX new drug, and the control group was treated with placebo. The clinical symptom score was used as the criterion for curative effect. The effectiveness was evaluated after observing a course of treatment (a total of 10 treatments).
the data shows
The collected clinical data are all stored in the authoritative clinical medical statistical analysis software JMP. As shown in the figure below, a total of 4 column variables and 6 rows of records are displayed. The first column represents the group using different treatment methods; the second column represents the specific efficacy, and its evaluation criteria are three levels: cured, improved, and unhealed. Standard evaluation; the third column shows the overall efficacy, the main difference between it and the second column is the sum of cured cases and improved cases into clinically effective cases; the fourth column shows the number of clinical trials that occurred under the corresponding conditions.
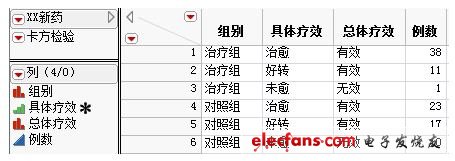
Figure 1 Clinical efficacy data of XX new drugs
Analysis methods and results
(All the statistical analysis reports and graphics below are based on the authoritative clinical medical statistical analysis software JMP.)
First of all, according to the characteristics of the data, choose the appropriate statistical graphics-mosaic map to understand the overall treatment of different treatment methods lead to differences in efficacy. It can be clearly seen from the figure below: whether in specific efficacy or overall efficacy, the effect of the treatment group is significantly better than the control group.
Figure 2 shows a mosaic of different treatment methods leading to differences in efficacy
Next, focus on the overall efficacy. Based on clinical data, quickly draw a contingency table between group and overall efficacy, as shown below. We can see more specifically: The overall efficacy rate of the treatment group is as high as 98.00%, while the overall efficacy rate of the control group is only 80.00%. There is a significant difference between the two.
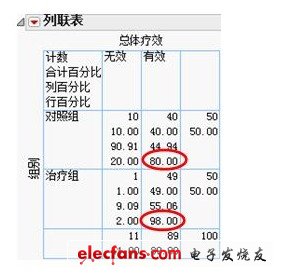
Figure 3 Contingency table of overall efficacy
Then, in order to prove that this difference is statistically significant, the chi-square test method was used to compare and analyze the therapeutic efficacy of the two groups of patients after treatment. The statistical analysis results are shown in the following figure. From the statistical results, the P value of the likelihood ratio chi-square test is 0.0021, the P value of the Pearson chi-square test is 0.0040, and the P value of the Fisher exact test is 0.0078. That is to say, all statistical test results believe that there is indeed a significant difference between the treatment effect of the treatment group and the control group. More precisely, the curative effect of the treatment group is significantly better than that of the control group. Therefore, we can confidently believe that taking XX new drugs can help to improve the clinical effect of treating angina pectoris and has the value of promotion.
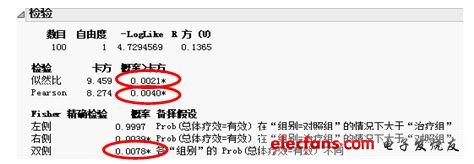
Figure 4 Results of chi-square test
About JMP
SAS (the world's largest statistical software company) launched a series of interactive visual statistical discovery software, including JMP, JMP Pro, JMP Clinical, JMP Genomics, SAS SimulaTIon Studio for JMP and other powerful product lines. Mainly used for statistical analysis. JMP's algorithm is derived from SAS, with special emphasis on the practical application of statistical methods. It has strong interactivity and visualization ability and is easy to use. It is especially suitable for data analysts with non-statistical backgrounds. It has a large advantage in similar software.
In the field of medicine, the US Food and Drug Administration (FDA), which is famous for its strictness and rigor, only accepts the statistical results obtained by SAS and JMP analysis for the statistical analysis part of the new drug report declared by pharmaceutical companies. More than 40% of its drug reviewers are JMP users.
Apple Macbook Battery,Macbook Battery
Shenzhen Aokal Technology Co., Ltd. , https://www.aokal.com